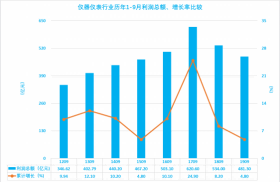
近日,上海行业协会发布了2019年1-9月仪器仪表行业经济运行概况。1-9月仪器仪表行业实现利润总额481.35亿元,同比增长4.78%;利润净增21.95亿元,比上年的40.24亿元减少45.46%。
1. 2019年1-9月仪器仪表行业经济运行状态及特点
1.1 仪器仪表行业2019年1-9月经济运行状态
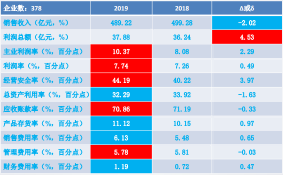
11个经济运行指标中:销售收入、利润总额、主业利润率、经营安全率、应收账款率、产品存货率和管理费用率好于上年同期;其余4个指标差于上年同期。
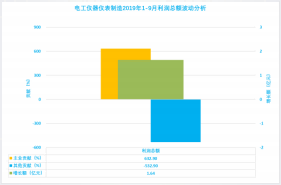
1.2 仪器仪表行业2019年1-9月利润总额波动分析

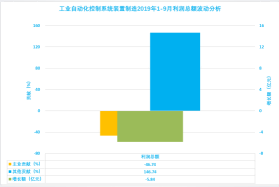
利润总额净增21.95亿元。主业利润增加59.03亿元,贡献度269.00%。其他利润减少37.09亿元、贡献度-169.00%。
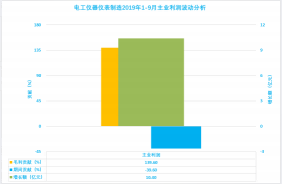
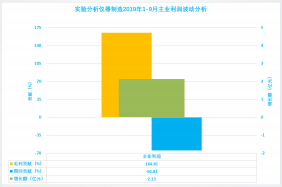
1.3.1 仪器仪表行业2019年1-9月主业利润波动分析
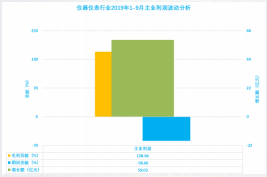
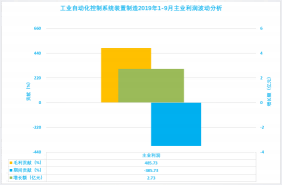
毛利增长93.67亿元,对主业利润增长59.03亿元的贡献度为158.66%。期间费用增加34.63亿元,贡献度为-58.66%。销售收入增长对毛利增长的贡献度为89.02%,毛利率上升0.19个百分点,贡献度为10.98%。毛利率上升对主业利润和利润总额增长的贡献度分别为17.426和46.85个百分点。
1.3.2 仪器仪表行业2019年1-9月主业利润质量比较
账面主业利润587.08亿元,应收账款导致到账的主业利润仅为327.80亿元,比上年减少7.79%。挂账主业利润259.28亿元,比上年增加127.34%。挂账主业利润比重44.16%,比上年增加19.87个百分点。
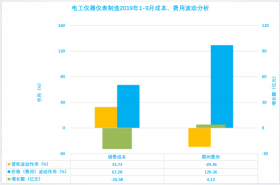
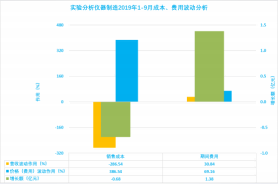
1.4 仪器仪表行业2019年1-9月成本、费用波动分析
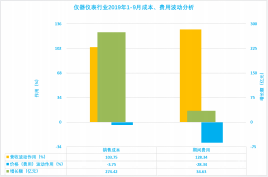
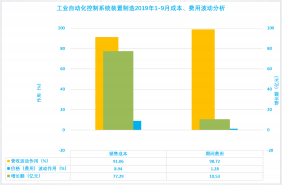
销售收入增长对销售成本增长的贡献度为103.75%(使销售成本增加284.71亿元),销售成本率下降0.19个百分点,贡献度为-3.75%(使销售成本降低10.28亿元)。销售收入增长对期间费用增加的贡献度为128.34%(使期间费用增加44.44亿元),期间费用率下降0.18个百分点,贡献度为-28.34%(使期间费用减少9.81亿元)。
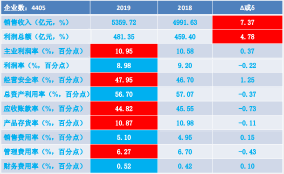
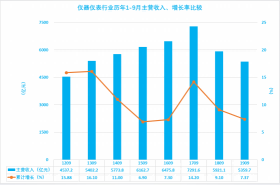
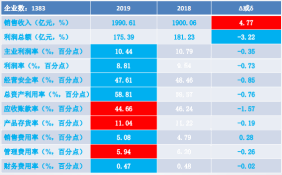
1.5 主营业务收入增长7.37%
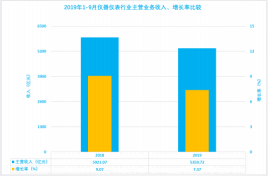
实现主营业务收入5359.72亿元,同比增长7.37%、 比上年下降1.70个百分点。 净增368.09亿元,比上年的492.38亿元减少25.24%。企业主营业务收入平均规模12167万元,同比增加836万元。
1.6 利润总额增长4.78%
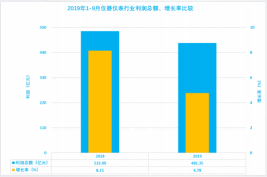
实现利润总额481.35亿元(其中主业利润贡献度121.97%,同比增加7.02个百分点)同比增长4.78%,比上年下降3.37个百分点。净增21.95亿元,比上年的40.24亿元减少45.46%。企业利润总额平均规模1092.7万元,比上年增加49.8万元。
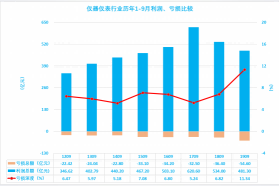
1.7 亏损面上升1.91个百分点
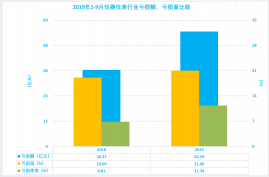
亏损额54.59亿 元。净增15.86亿元,上年为3.04亿元。亏损面21.00%,比上年上升1.91个百分点。亏损深度11.34%,比上年上升4.53个百分点。
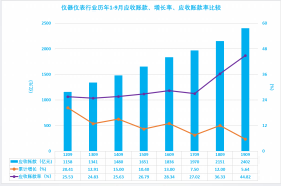
1.8 应收账款增长5.64%
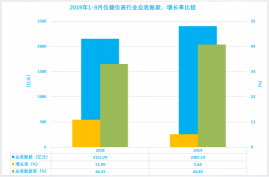
应收账款2402.19亿元,比上年同期增长5.64%。净增128.33亿元,比上年的230.33亿元减少44.28%。应收账款达到主营业务收入的44.82%,比上年高8.49个百分点。
1.9 成本费用上升6.92%
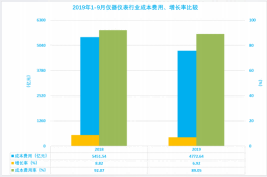
成本费用4772.64亿元,比上年同期上升6.92%。净增309.05亿元,比上年的442.06亿 元降低30.09%。成本费用率89.05%,比上年降 低3.02个百分点。
1.10 产成品增长6.00%
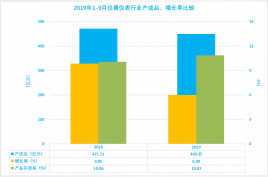
产成品449.35亿元,比上年同期增 长6.00%。净增25.43亿元,比上年的42.32亿元下降39.92%。产品存货率10.87%,比上年高0.80个百分点。
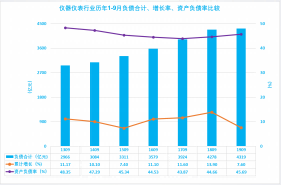
1.11 负债增长7.58%
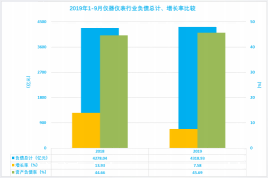
负债总计4318.93亿元,比上年同期增长7.58%。净增304.16亿元,比上年的522.93亿元减少41.84%。资产负债率45.69%,比上年 高1.03个百分点。
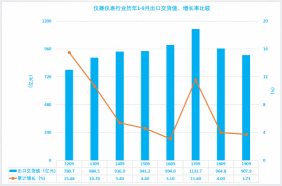
1.12 出口交货值增长3.73%
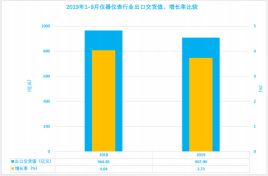
出口交货值907.90亿元,比上年同期增长3.73%。净增32.66亿元,比上年的37.45亿元减少12.79%。增长率比上年降低0.31个百分点。
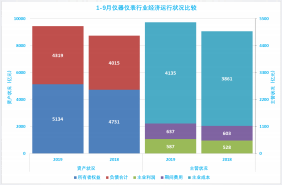
1.13 经济运行状况比较
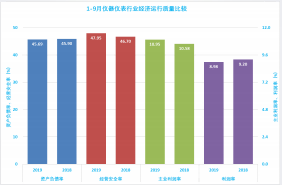
1.14 经济运行质量比较
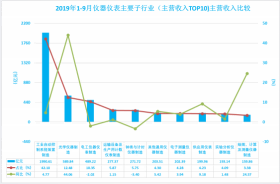
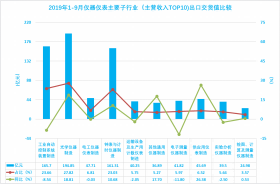
1.15 2019年1-9月仪器仪表主要子行业(主营收入TOP10)主营收入比较
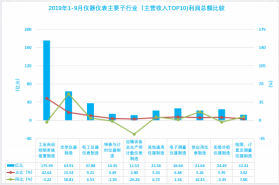
1.16 2019年1-9月仪器仪表主要子行业(主营收入TOP10)利润总额比较
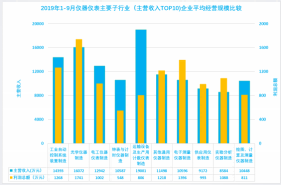
1.17 2019年1-9月仪器仪表主要子行业(主营收入TOP10)企业平均经营规模比较
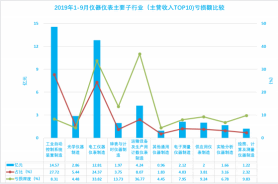
1.18 2019年1-9月仪器仪表主要子行业(主营收入TOP10)亏损企业数比较
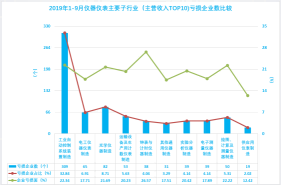
1.19 2019年1-9月仪器仪表主要子行业(主营收入TOP10)亏损额比较
1.20 2019年1-9月仪器仪表主要子行业(主营收入TOP10)出口交货值比较
2. 仪器仪表行历年1-9月经济运行状态比较
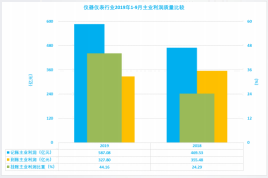
2.1 仪器仪表行业历年1-9月主营收入、增长率比较
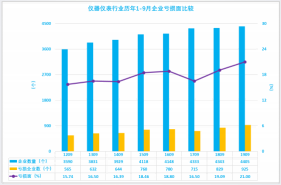
2.2 仪器仪表行业历年1-9月利润总额、增长率比较
2.3 仪器仪表行业历年1-9月利润、亏损比较
2.4 仪器仪表行业历年1-9月企业亏损面比较
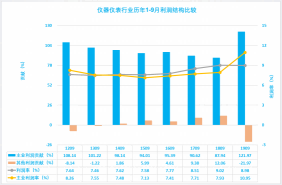
2.5 仪器仪表行业历年1-9月利润结构比较
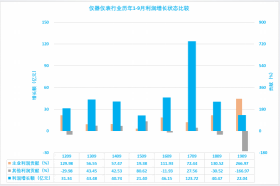
2.6 仪器仪表行业历年1-9月利润增长状态比较
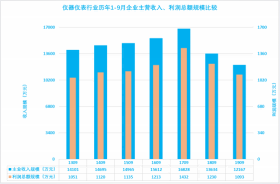
2.7 仪器仪表行业历年1-9月企业主营收入、利润总额规模比较
2.8 仪器仪表行业历年1-9月经营安全率比较

2.9 仪器仪表行业历年1-9月应收账款、增长率、应收账款率比较
2.10 仪器仪表行业历年1-9月负债合计、增长率、资产负债率比较
2.11 仪器仪表行业历年1-9月出口交货值、增长率比较
3. 2019年1-9月仪器仪表重要子行业经济运行状态及特点
3.1 工业自动化装置制造经济运行状态
3.1.1 工业系统装置制造2019年1-9月经济运行状态
3.1.2 工业自动化控制系统装置制造2019年1-9月利润总额波动分析
3.1.3 工业自动化控制系统装置制造2019年1-9月主业利润波动分析
3.1.4 工业自动化控制系统装置制造2019年1-9月成本、费用波动分析
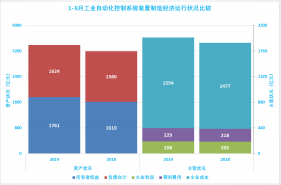
3.1.5 1-9月工业自动化控制系统装置制造经济运行状况比较
3.1.6 1-9月工业自动化控制系统装置制造经济运行质量比较

3.2 制造经济运行状态
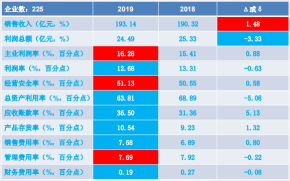
3.2.1 电工仪器仪表制造2019年 1-9月经济运行状态
3.2.2 电工仪器仪表制造2019年1-9月利润总额波动分析
3.2.3 电工仪器仪表制造2019年1-9月主业利润波动分析
3.2.4 电工仪器仪表制造2019年1-9月成本、费用波动分析
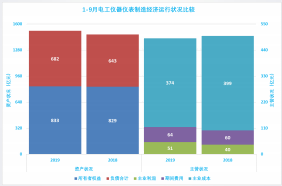
3.2.5 1-9月电工仪器仪表制造经济运行状况比较
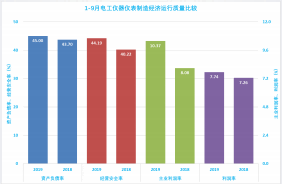
3.2.6 1-9月电工仪器仪表制造经济运行质量比较
3.3 实验分析仪器制造经济运行状态
3.3.1 实验分析仪器制造2019年 1-9月经济运行状态
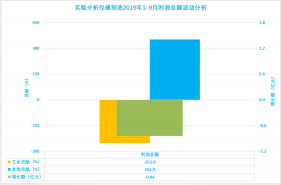
3.3.2 实验分析仪器制造2019年1-9月利润总额波动分析
3.3.3 实验分析仪器制造2019年1-9月主业利润波动分析
3.3.4 实验分析仪器制造2019年1-9月成本、费用波动分析
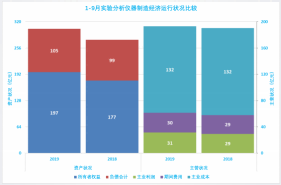
3.3.5 1-9月实验分析仪器制造经济运行状况比较
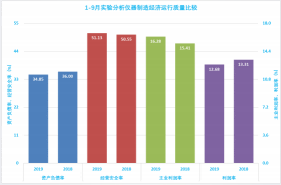
3.3.6 1-9月实验分析仪器制造经济运行质量比较
3.4 仪器仪表、自动化仪表、电工仪表、分析仪器经济运行状态比较
3.4.1 经济运行质量比较
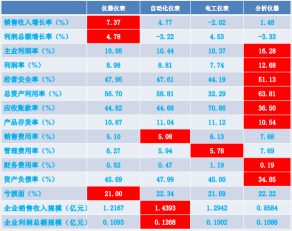
3.4.2 利润结构、主业利润率、增长率比较比较
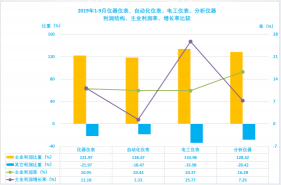
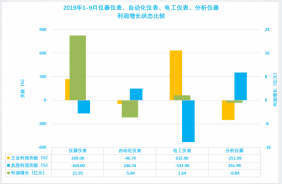
3.4.3 利润增长状态比较
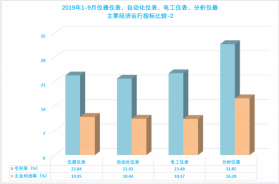
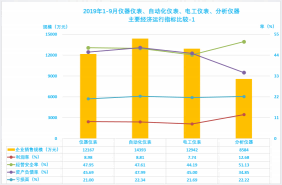
3.4.4 主要经济运行指标比较-1
3.4.5 主要经济运行指标比较-2